

Win more business with an AI voice receptionist
Win more business with AI assistants
Never miss a call or lead with an AI receptionist that answers FAQs, filters SPAM calls, qualifies leads, and books jobs directly into your calendar 24/7.
Never miss a call or lead with an AI assistant that answers FAQs, filters SPAM calls, qualifies leads, and fills your calendar with appointments 24/7.
Grow your business without adding staff
Never let a missed call go to your competition
67% of customers hang up if they don’t receive immediate assistance.
85% of missed calls never call back. That’s business slipping through your fingers.
92% of customer interactions happen over the phone. Can you afford to miss even one?
75% of consumers believe that calling is
the fastest way to get a response.
60% of customers prefer speaking to a representative over leaving a voicemail.

Never let a missed call go to your competition
67% of customers hang up if they don’t receive immediate assistance.
85% of missed calls never call back. That’s business slipping through your fingers.
92% of customer interactions happen over the phone. Can you afford to miss even one?
75% of consumers believe that calling is the fastest way to get a response.
60% of customers prefer speaking to a representative over leaving a voicemail.
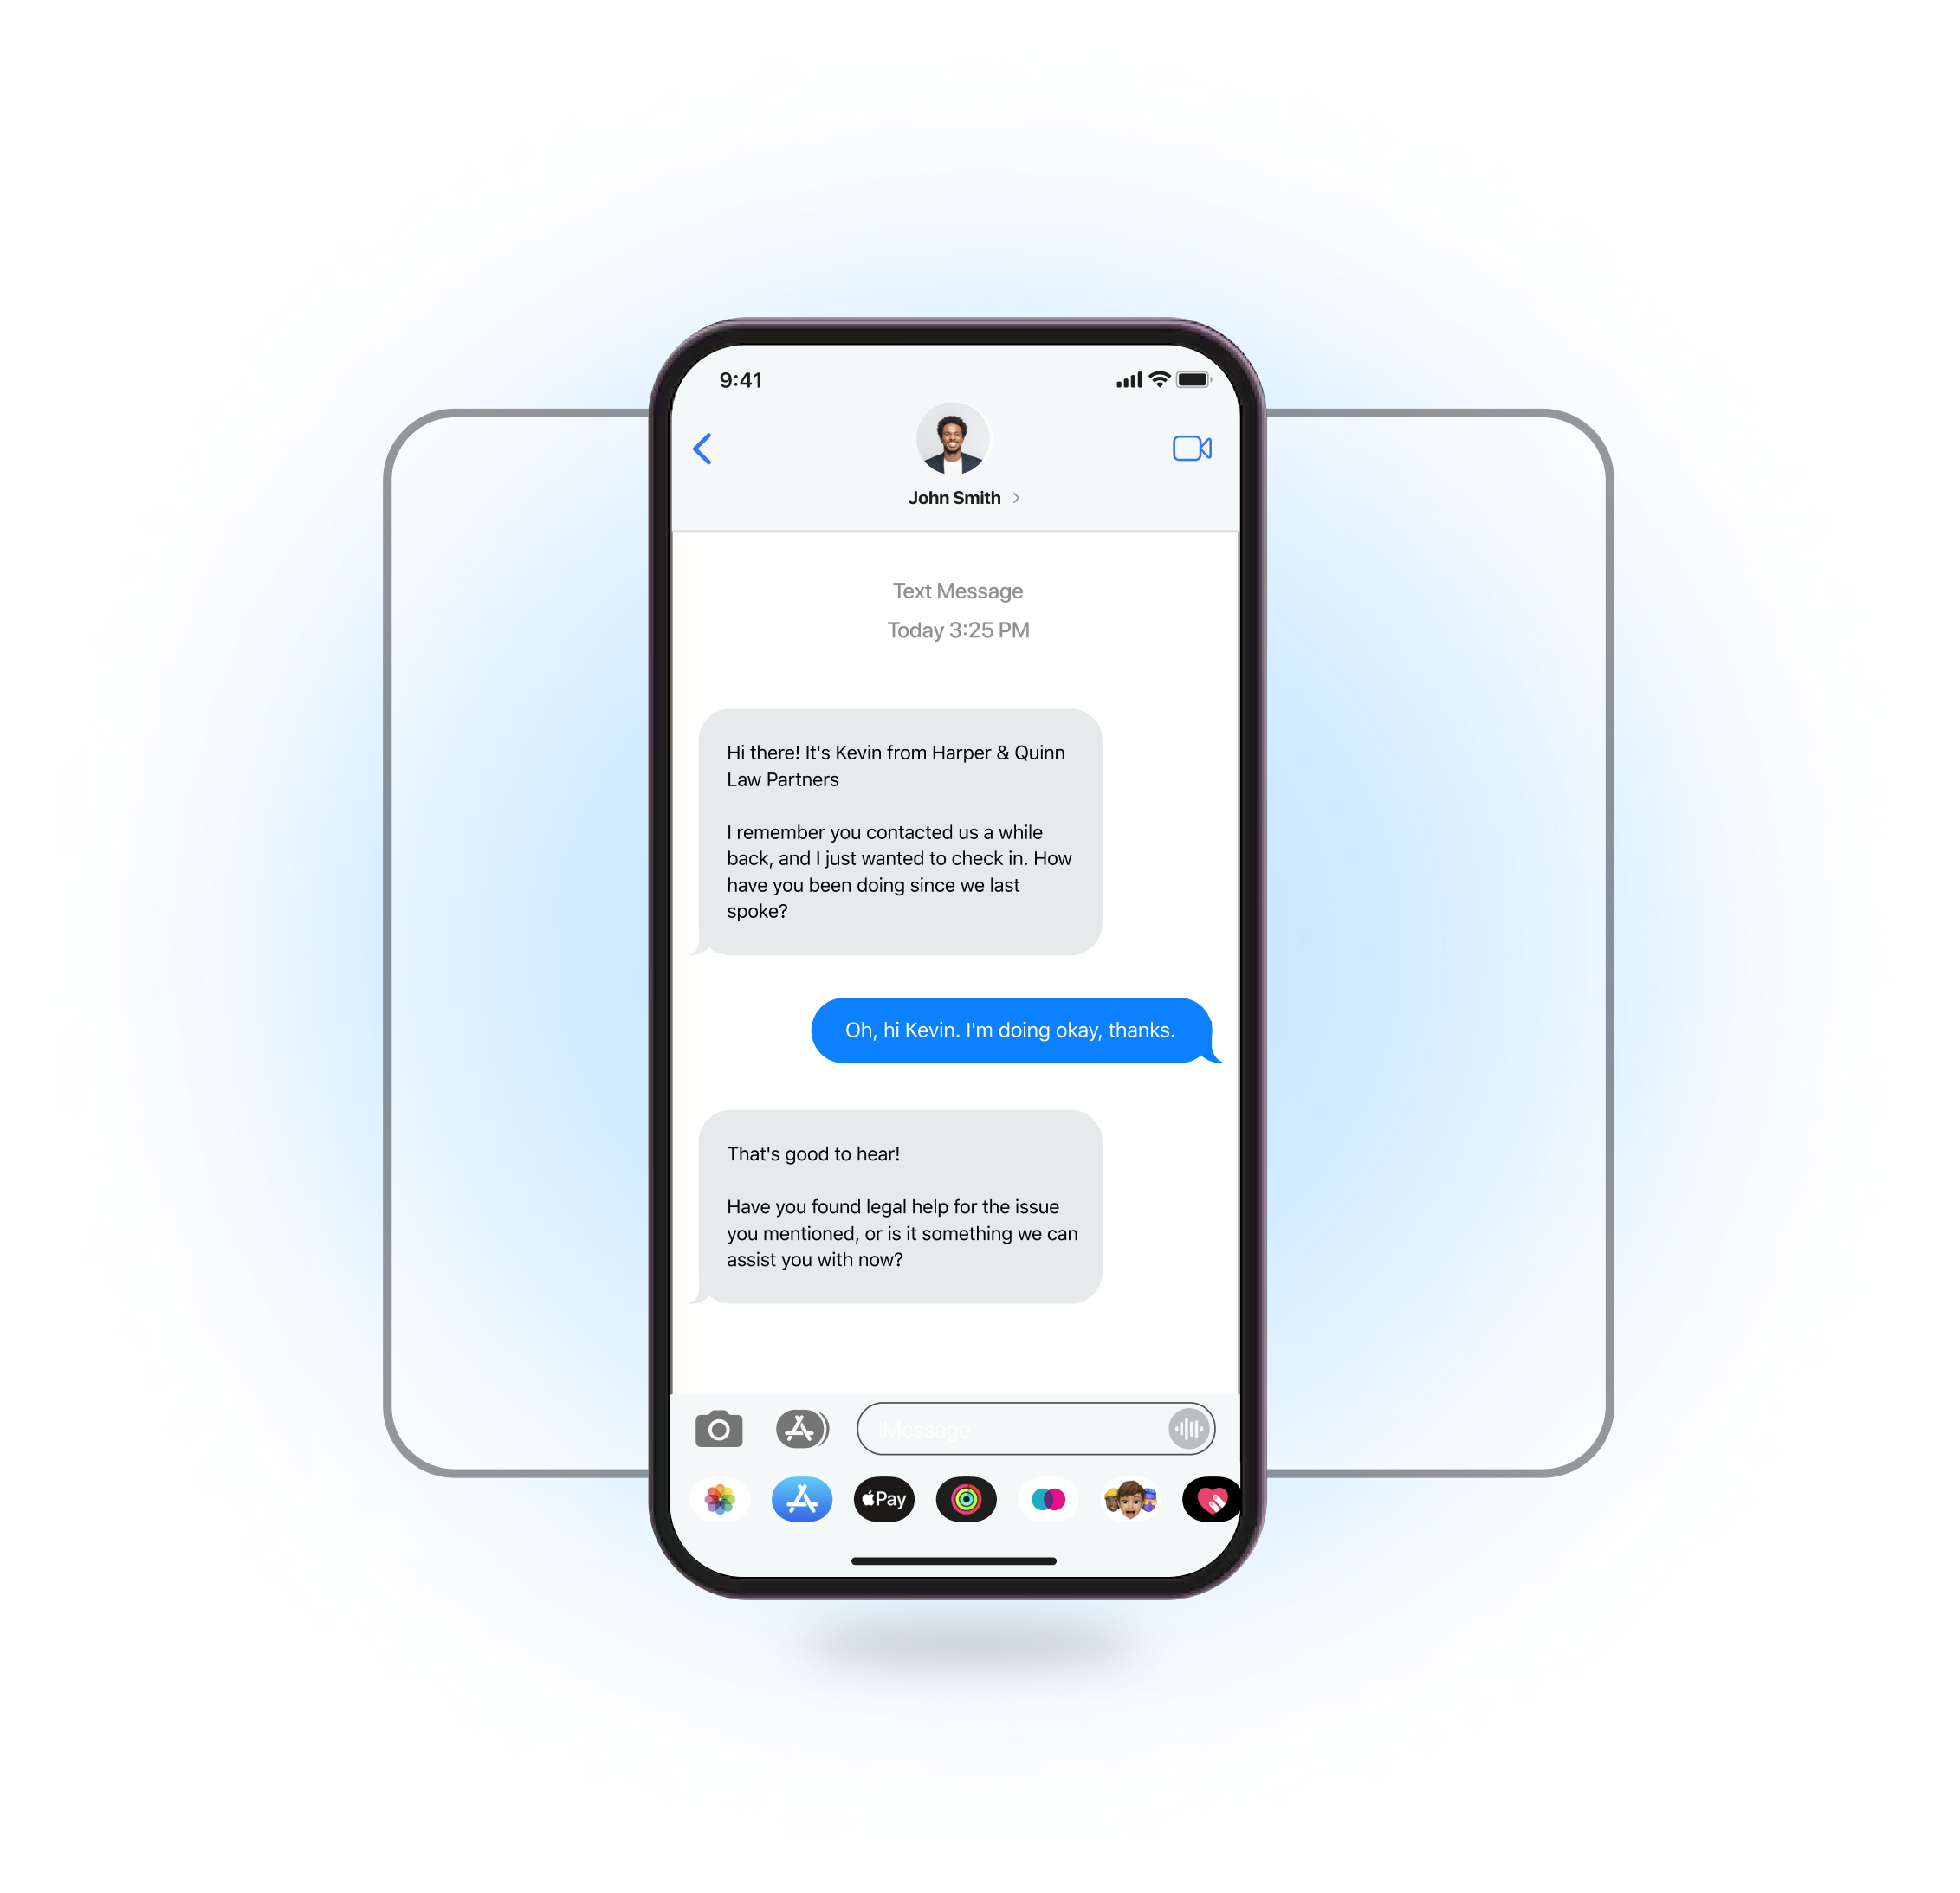

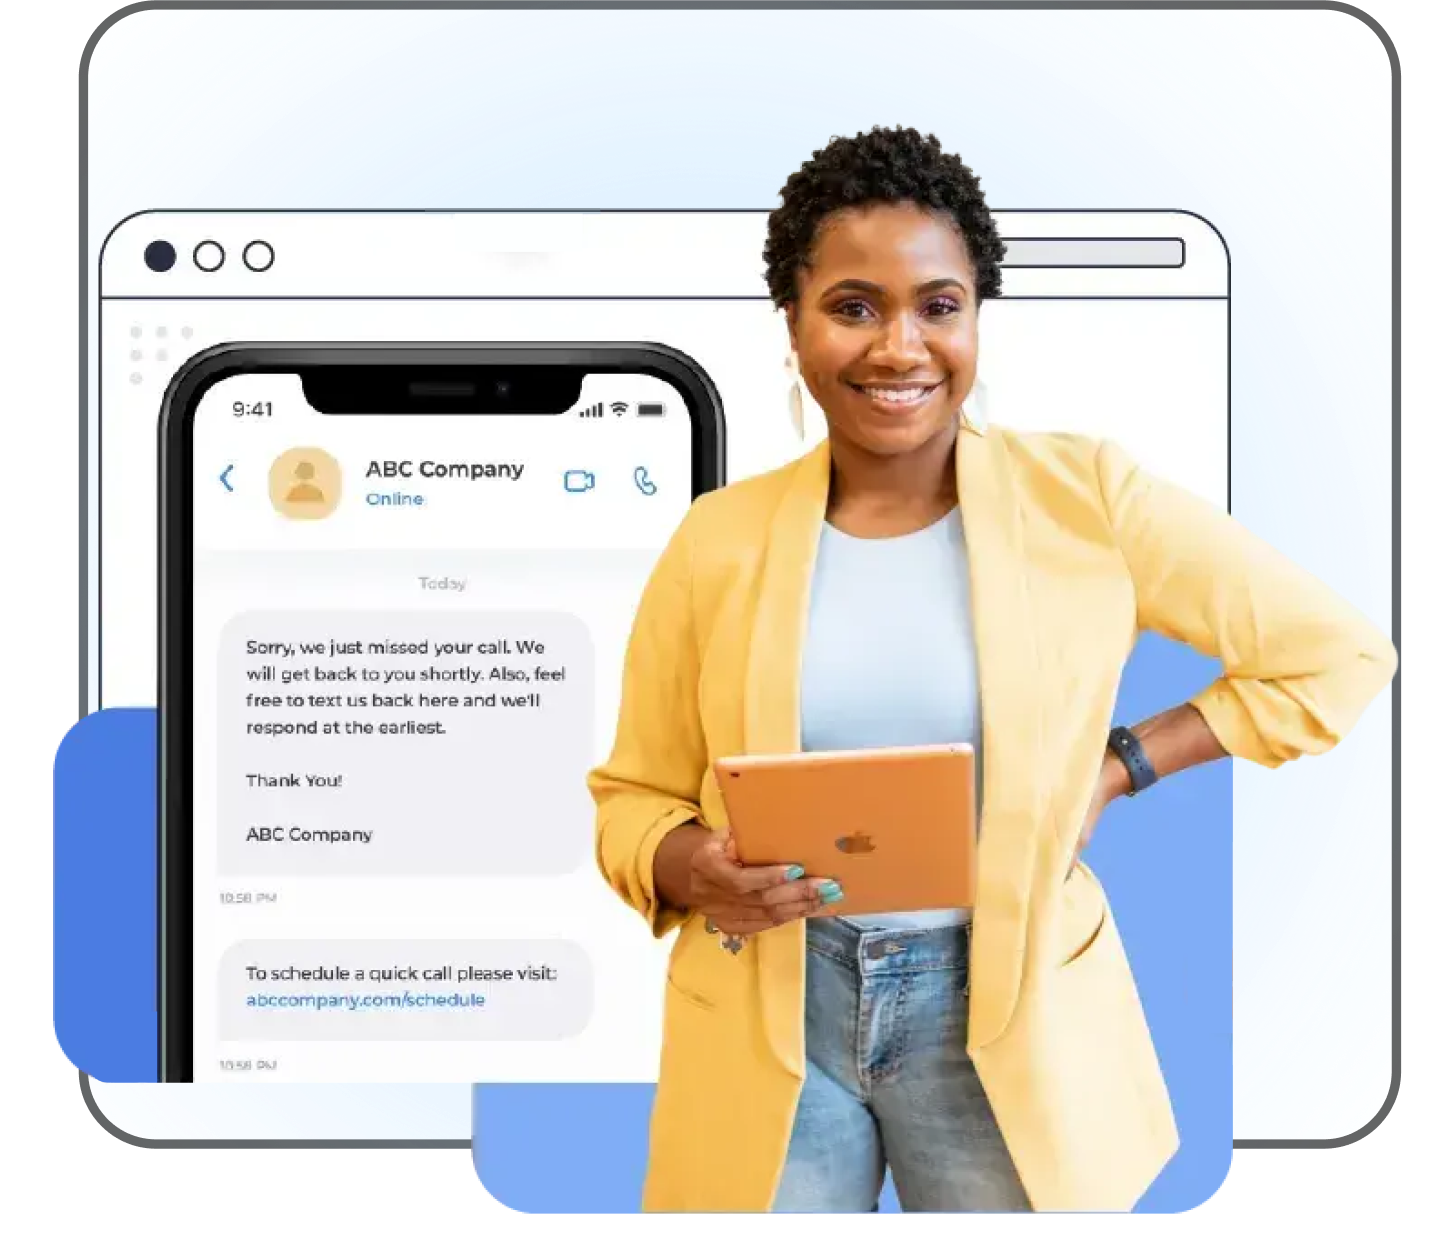
Immediately respond to texts and chats
Respond instantly to every text and chat so no lead slips through the cracks or goes to a competitor.
Immediately respond to texts & chats
Respond instantly to every text and chat so no lead slips through the cracks or goes to a competitor.

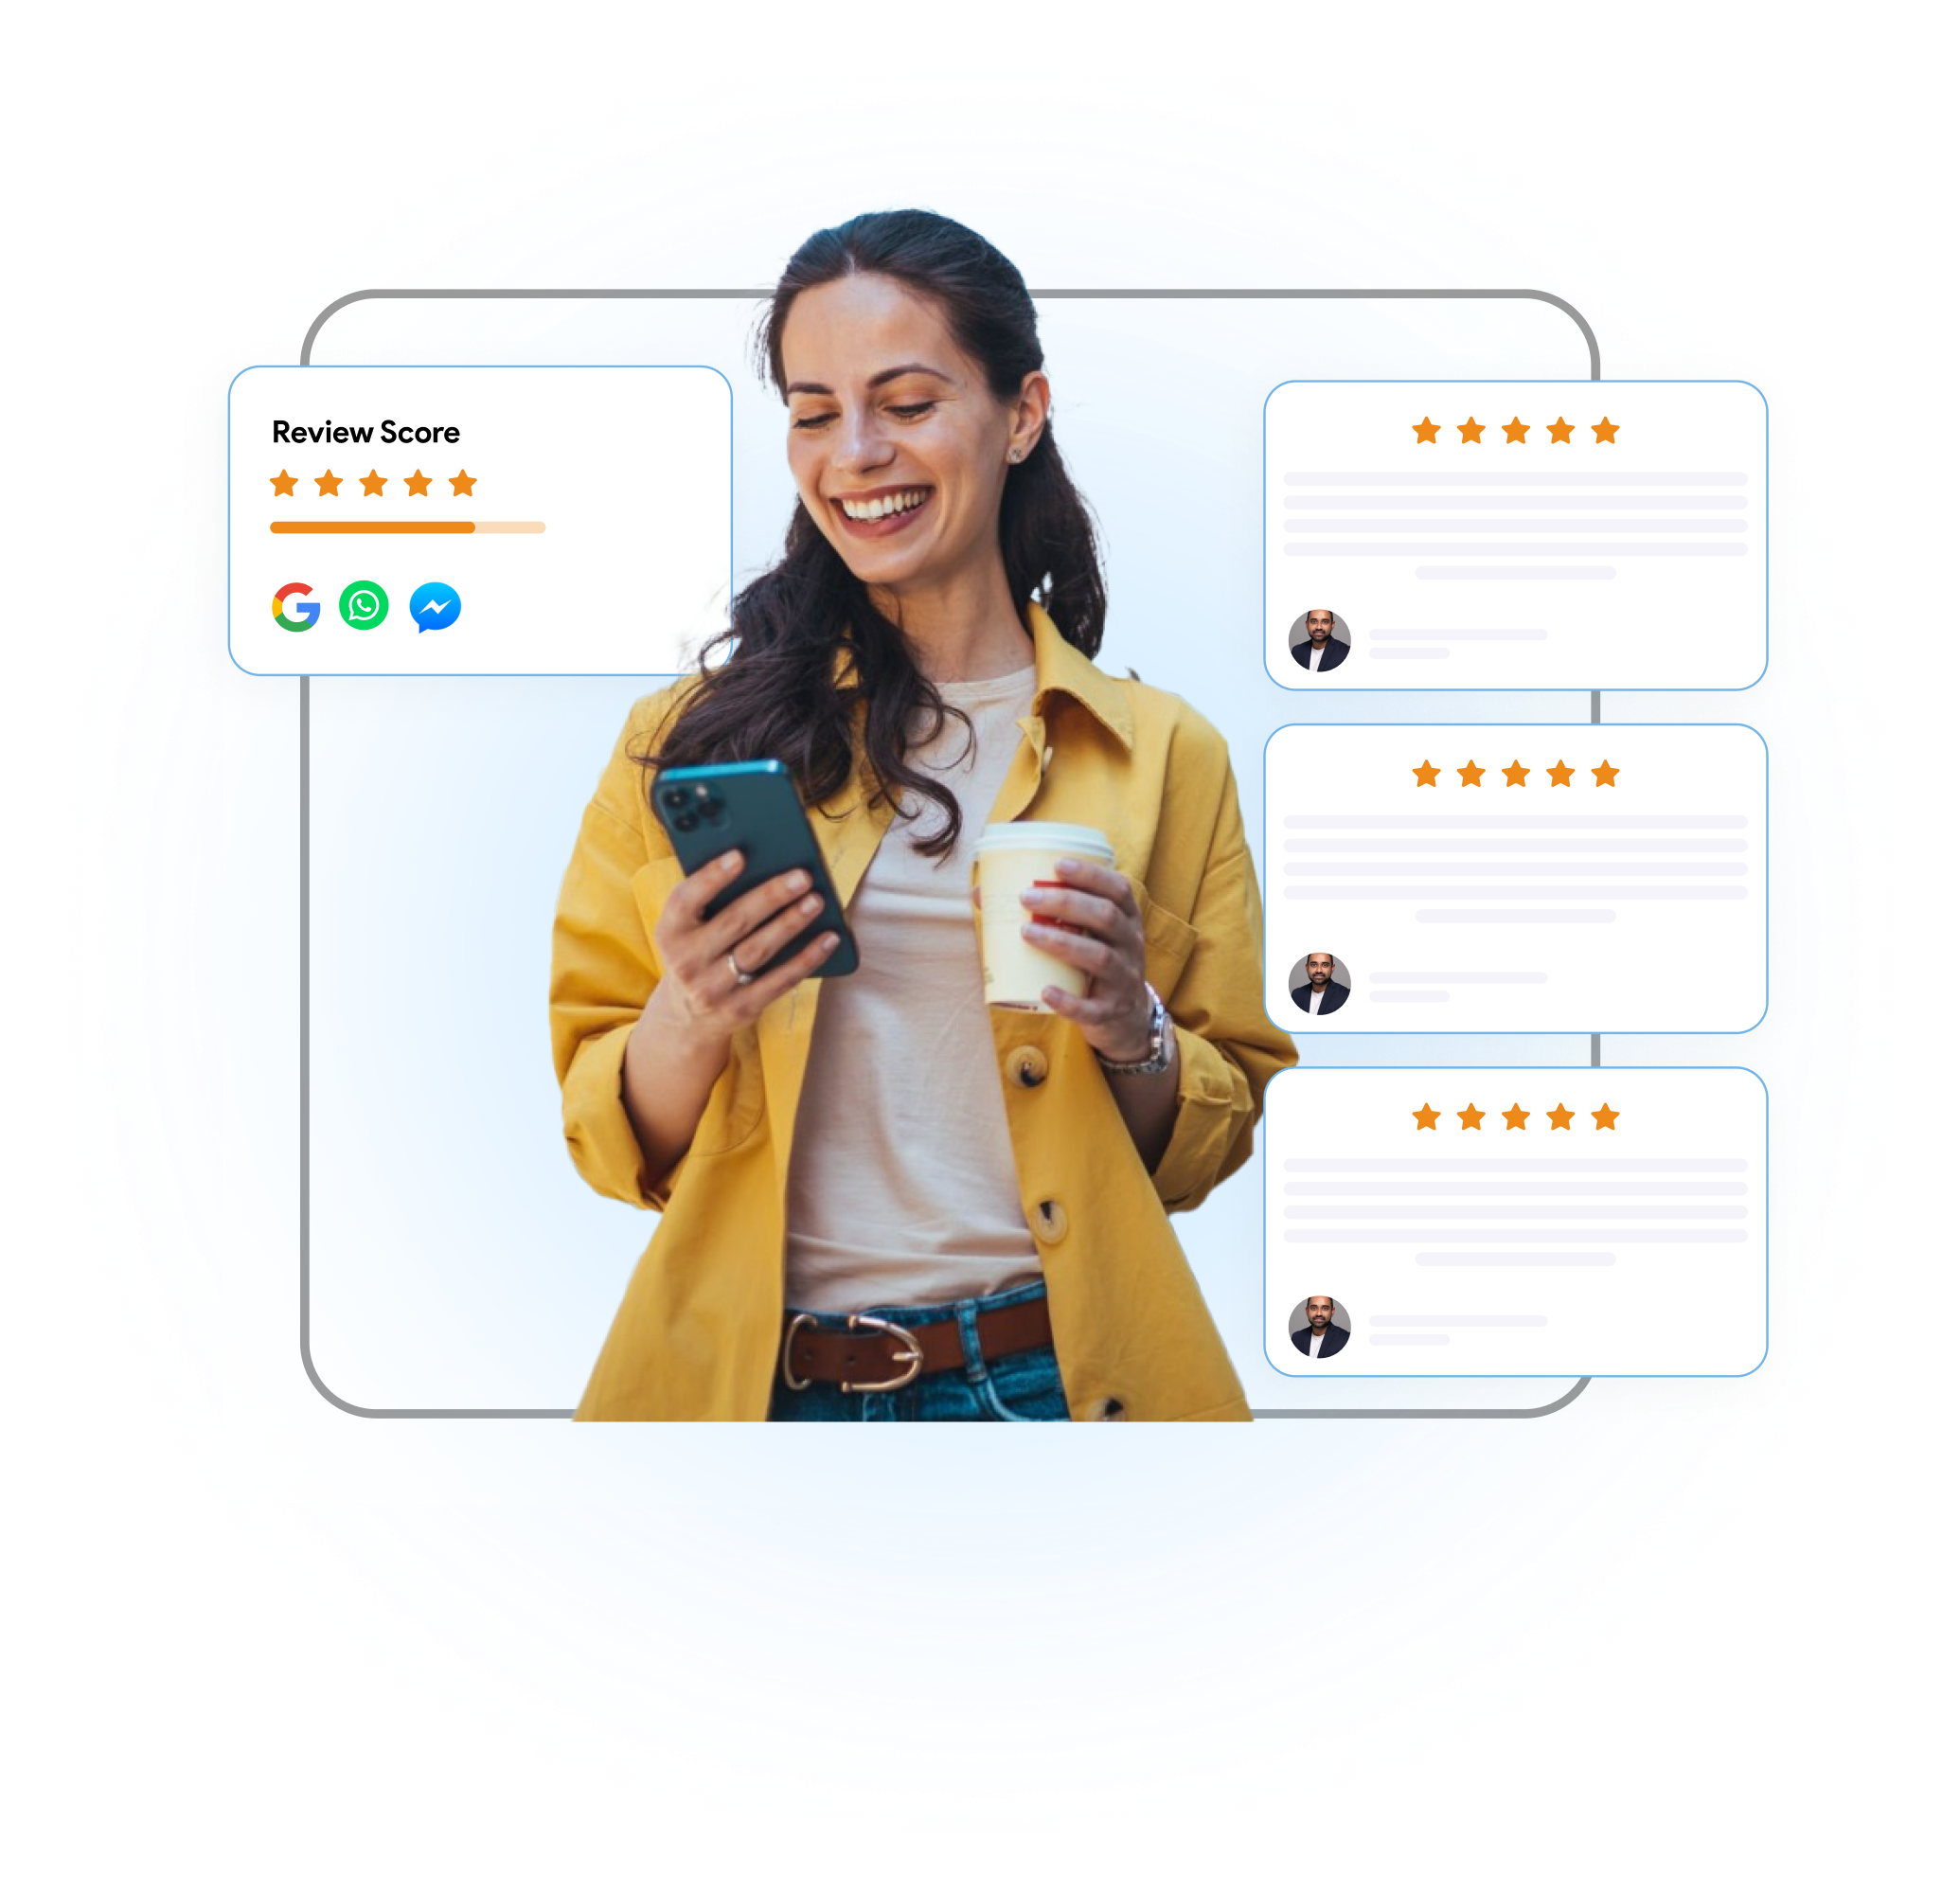
Boost your ranking with more 5-star reviews
We make it easy to increase positive reviews from previous and new customers automatically so your business ranks higher on Google.
Boost your ranking with more 5-star reviews
We make it easy to increase positive reviews from previous and new customers automatically so your business ranks higher on Google.

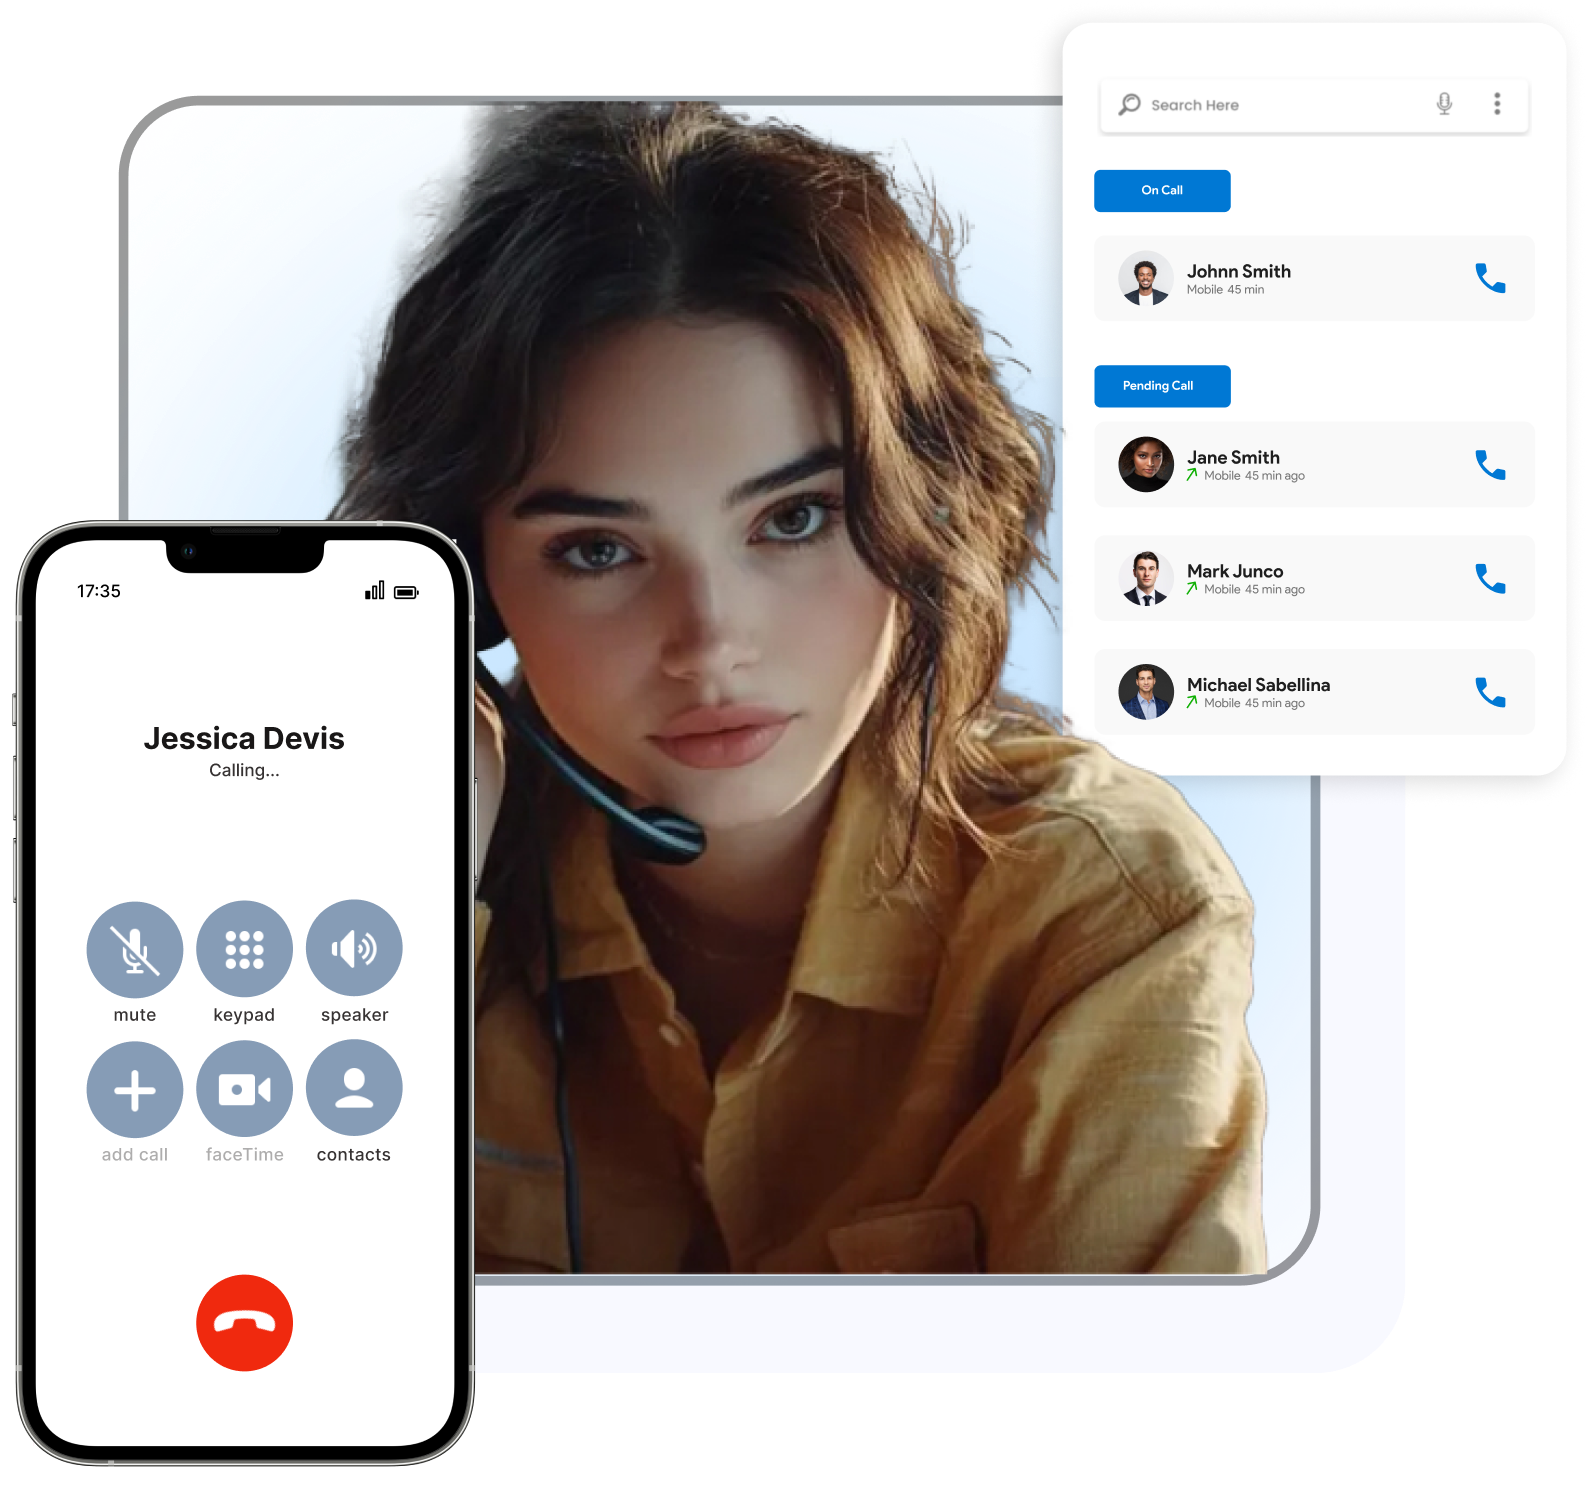
Never miss a buyer call, text, or chat
Instantly respond to calls, texts, and chats 24/7 so you never miss a lead, even after hours, on weekends, or when you’re busy on a job.
Never miss a buyer call, text, or chat
Instantly respond to calls, texts, and chats 24/7 so you never miss a lead, even after hours, on weekends, or when you’re busy on a job.

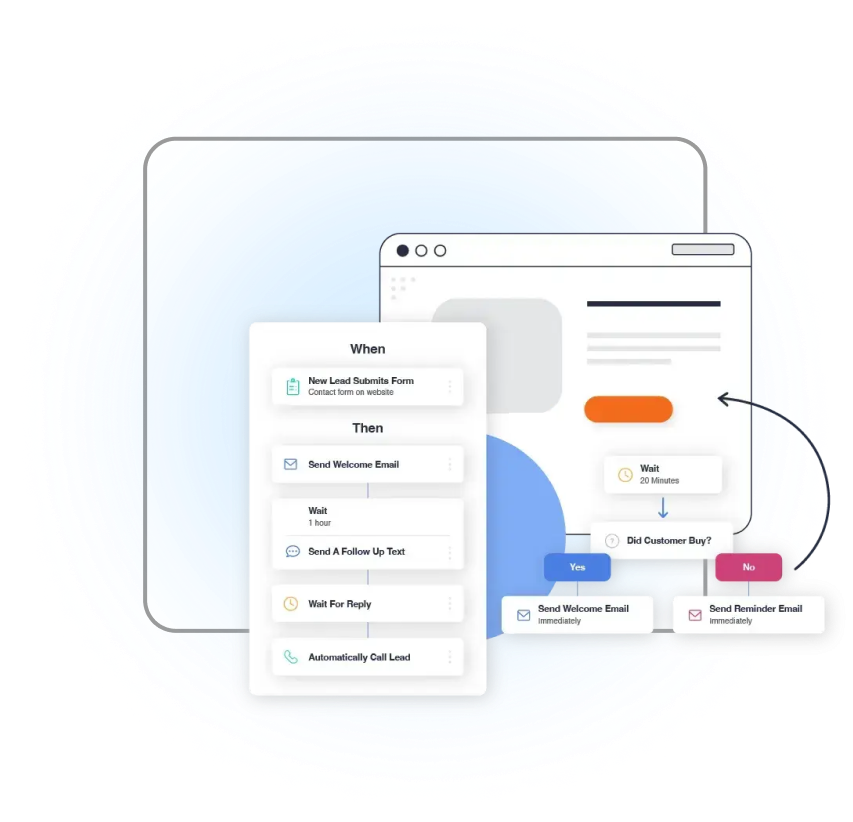
Book more jobs without more admin work
ServiceEdge automates your calls, texts, scheduling, and reminders so you can book more jobs and spend less time chasing leads or doing paperwork.
Book more jobs without more admin work
ServiceEdge automates your calls, texts, scheduling, and reminders so you can book more jobs and spend less time chasing leads or doing paperwork.

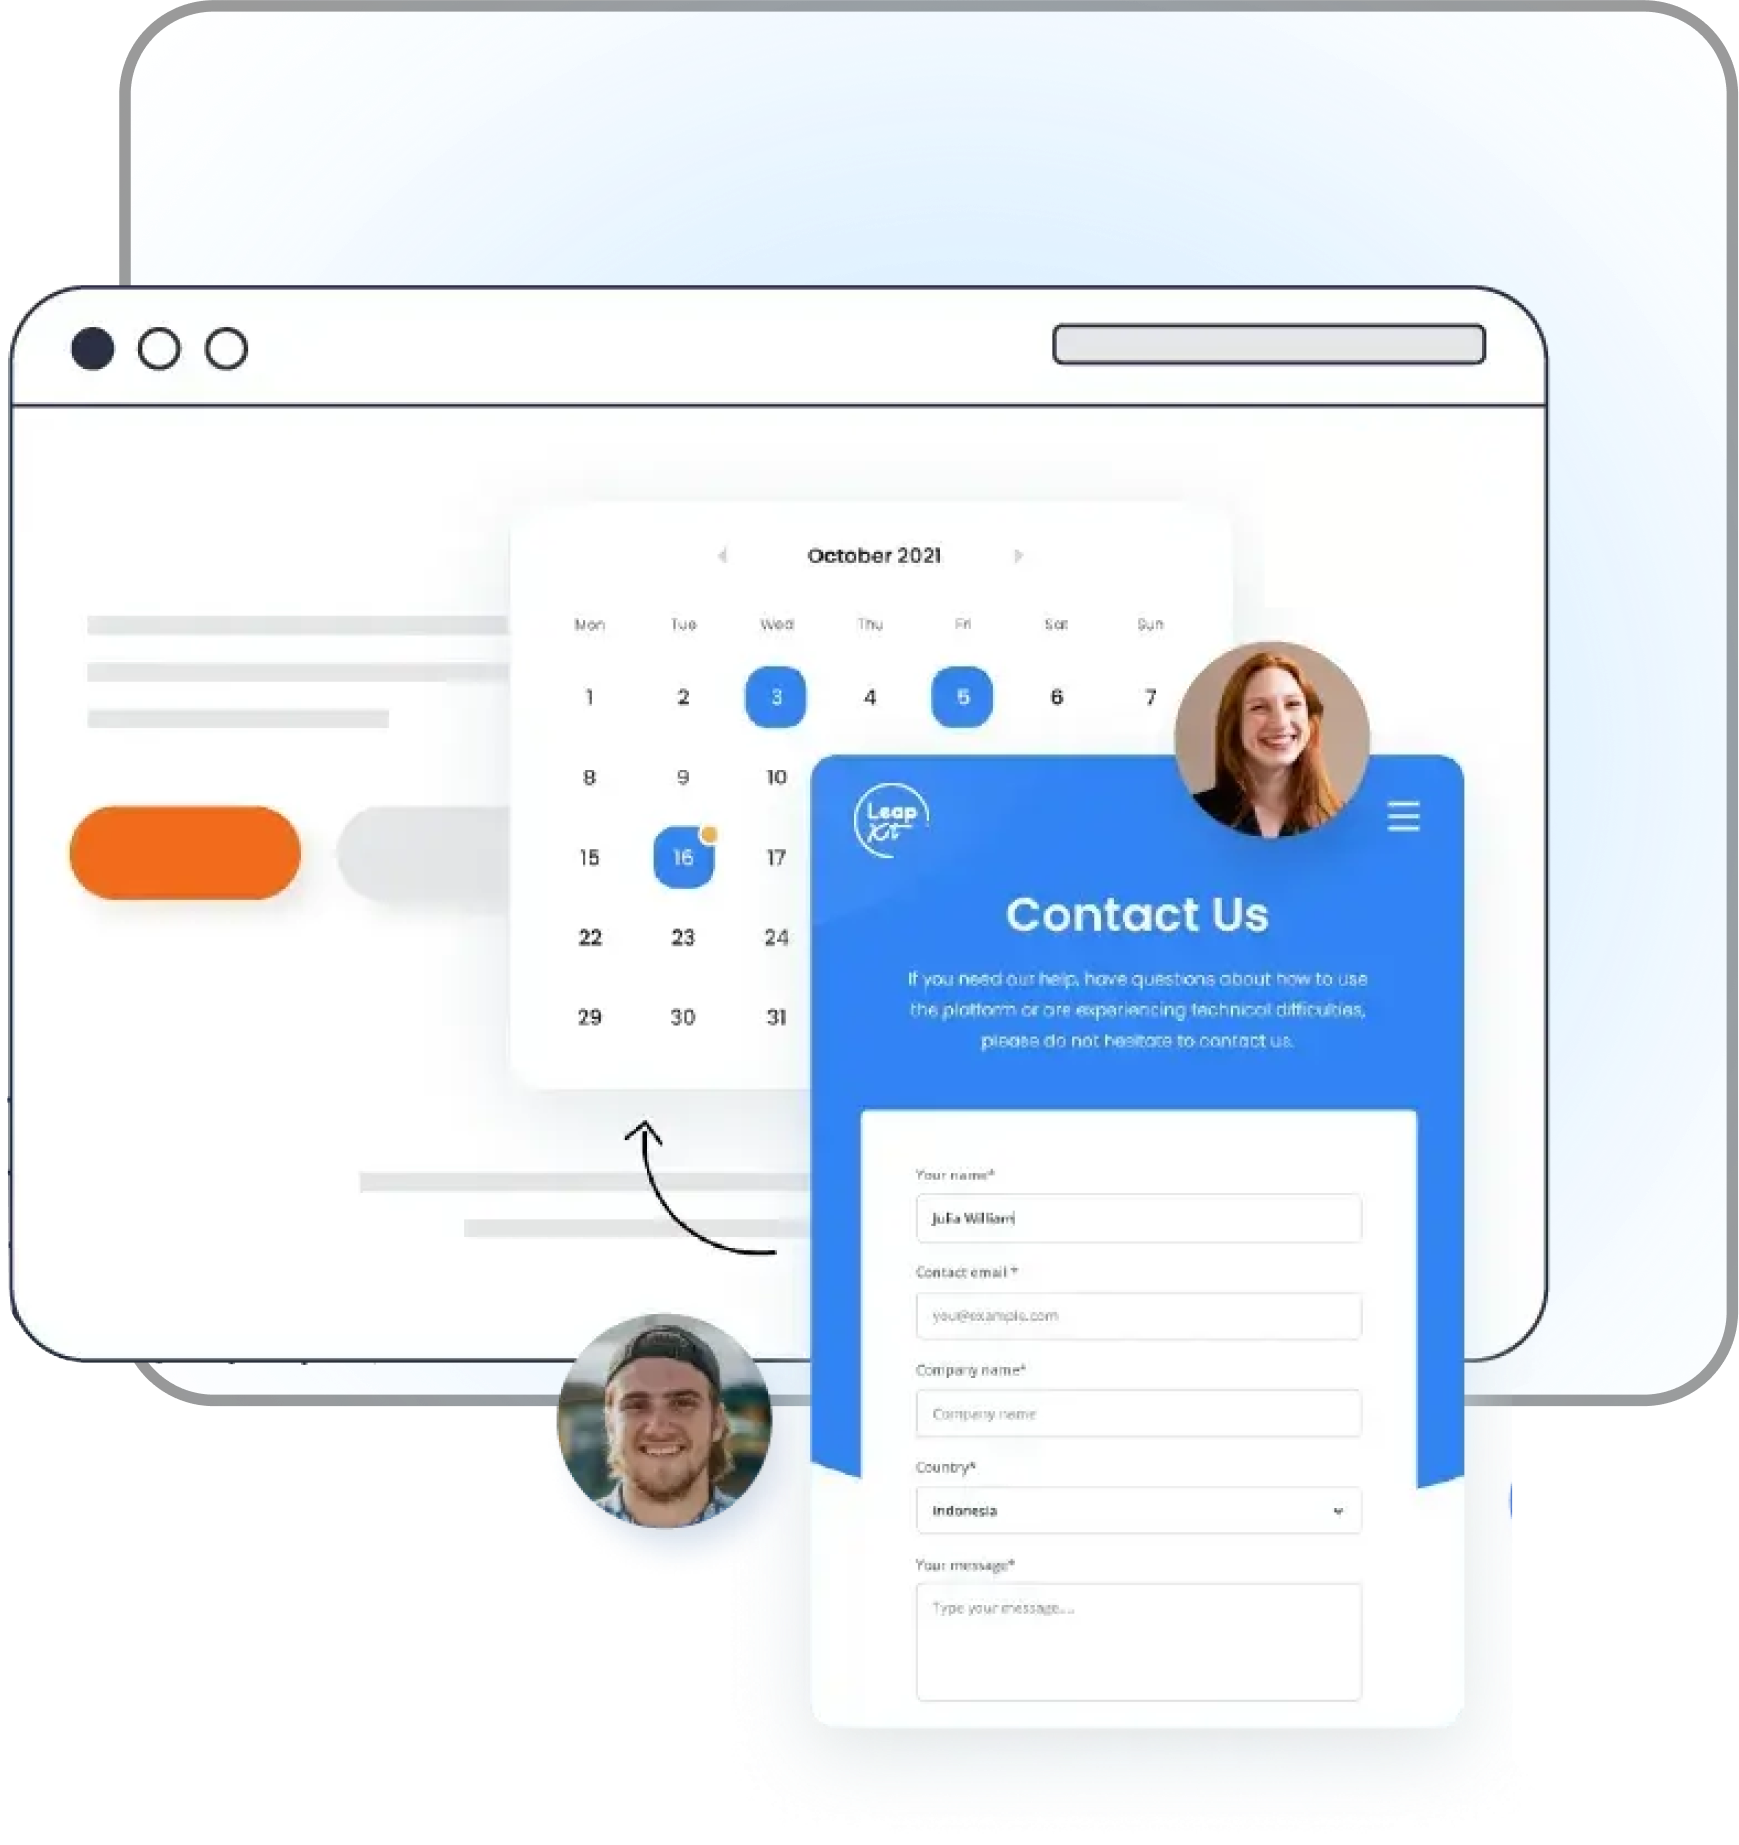
Instantly fill your calendar with qualified leads
Say goodbye to missed sales opportunities! Service Edge makes scheduling appointments feel magically easy so that you can close more deals!
Instantly fill your calendar with qualified leads
Say goodbye to missed sales opportunities! Service Edge makes scheduling appointments feel magically easy so that you can close more deals!

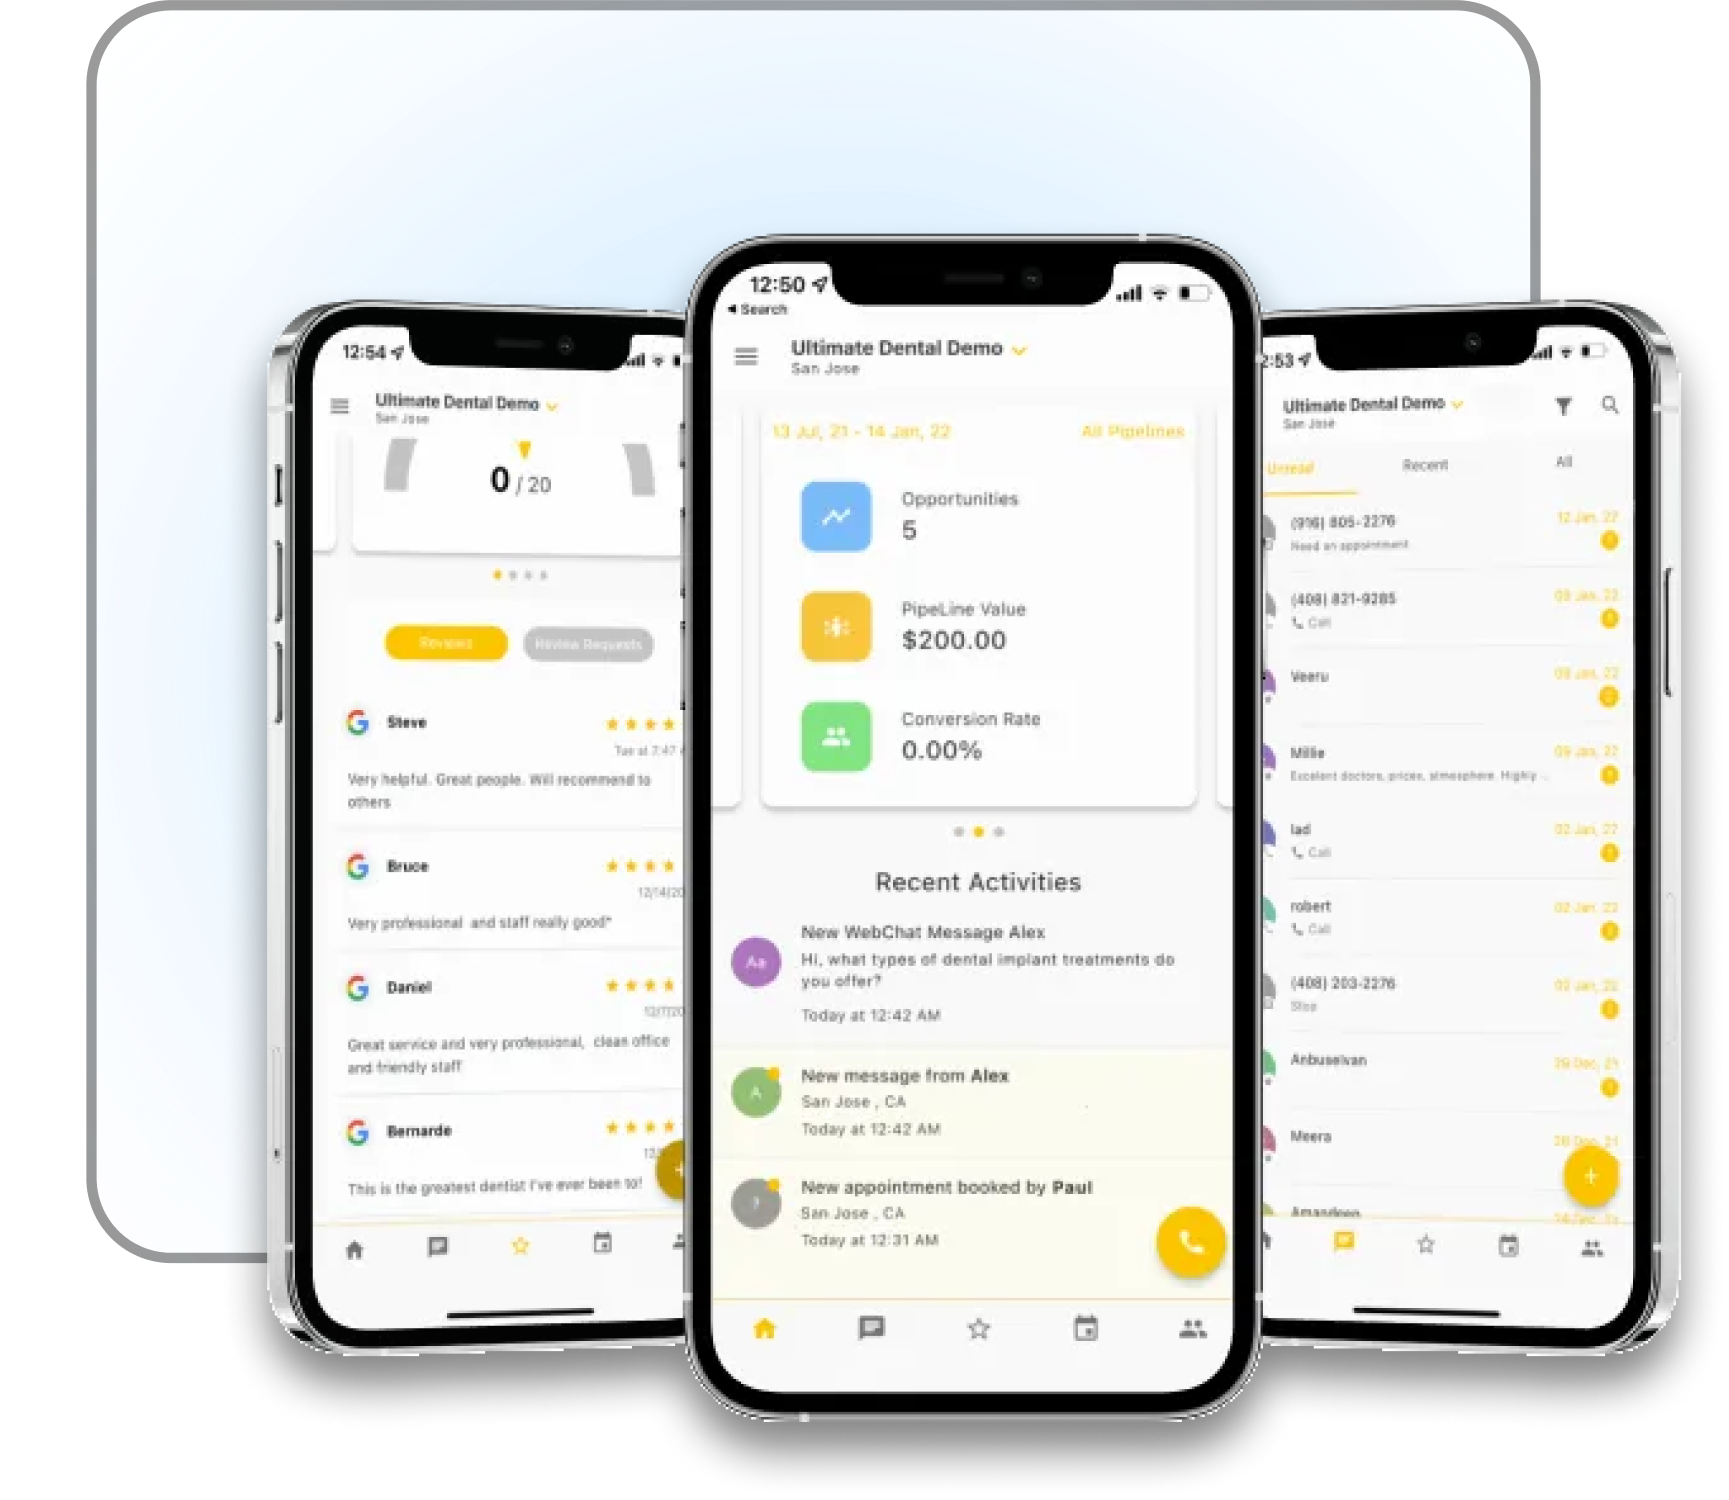
Turn your phone into a revenue generator
Access your entire lead, calendar, and review system in one mobile app so you can run the business from anywhere and at any time
One inbox for calls, texts, email, and social DMs
Instant missed-call texts and message notifications
See, update, and manage leads in real time
Book, manage, and confirm appointments on the go
Instantly respond to Google and Facebook reviews
Turn your phone into a revenue generator
Access your entire lead, calendar, and review system in one mobile app so you can run the business from anywhere and at any time.
Manage calls, texts, email, and socials from one inbox
Get instant missed-call texts & message notifications
See, update, and manage leads and pipeline
Book, manage, and confirm appointments
Get notified Google, Facebook, & Instagram reviews
Meet your AI voice assistant
ServiceEdge AI voice assistants sound natural, friendly, and professional.
Click on one of our AI voice assistant's picture to hear how she answers calls and speaks with customers.

Anna
SaaS Startup AI receptionist
Jenny
Home Services AI receptionist

Samantha
Law Firm AI receptionist
AI Voice Assistant
ServiceEdge AI voice assistants sound natural, friendly, and professional
Click on one of our AI voice assistant's picture to experience how she'd interact with your customers.
Anna
Home Services Business
Jenny
SaaS Startup
Samantha
Plumbing Business
AI Chat Assistant
Engage with leads & customers
on multiple channels.
AI SMS
When application users ask for data, they don’t want static metrics and charts. They want data in a form that enables interactive exploration. For example, plant managers need to uncover contributing factors to their operating KPIs: the right visualization.
Missed Call Text Back
When application users ask for data, they don’t want static metrics and charts. They want data in a form that enables interactive exploration. For example, plant managers need to uncover contributing factors to their operating KPIs: the right visualization.
Webchat
When application users ask for data, they don’t want static metrics and charts. They want data in a form that enables interactive exploration. For example, plant managers need to uncover contributing factors to their operating KPIs: the right visualization.
Meta Ad
When application users ask for data, they don’t want static metrics and charts. They want data in a form that enables interactive exploration. For example, plant managers need to uncover contributing factors to their operating KPIs: the right visualization.
Let
Service Edge
work for your business 24/7
Plans Start at $397/month